Power BI for Office 365 first thoughts
Data & analysis Power BI for Office 365 first thoughts

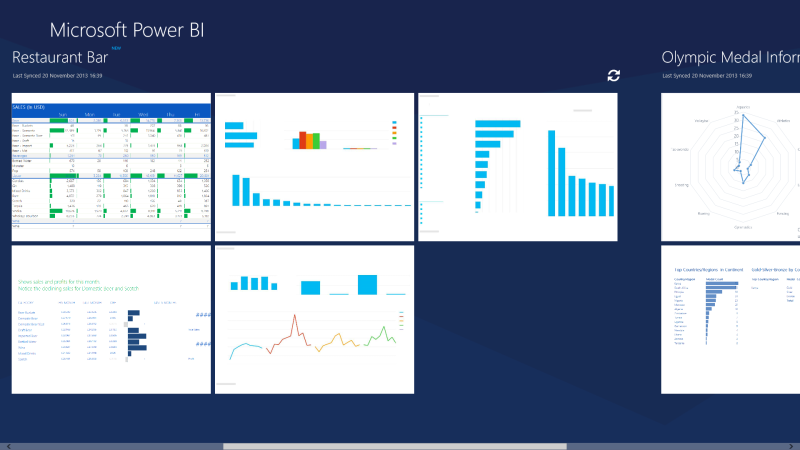
I’ve been meaning to write something on Power BI for a long time now, and I’m a little late in getting round to writing this, as most of the dust has already settled after Microsoft sent out the first round of invites to the Power BI for Office 365 preview, and a lot of people have produced some amazing work with Power BI. Chris Webb has written a pretty comprehensive review on his blog, as have countless others.

read more
Microsoft announces Power BI for Office 365
Data & analysis Microsoft announces Power BI for Office 365

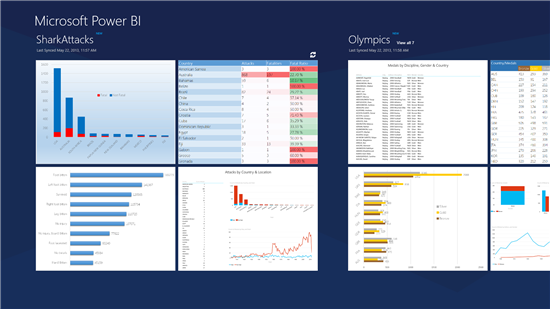
After launching a number of really neat self-service business intelligence plugins and components over the past couple of years, Microsoft has finally announced their complete self-service BI package: Power BI for Office 365. Incorporating Microsoft’s four big self-service BI components of the past year or so; PowerPivot, PowerView, Data Explorer and GeoFlow, the Power BI suite combines these parts into a single, unified offering. Most exciting of all though, is the inclusion of a mobile application for either Windows (I’m assuming Win 8) or iPad, which could very well be the secretive “Project Helix”, revealed at last year’s SharePoint Conference.

read more
GeoFlow brings 3D geographical visualisation to Excel 2013
Data & analysis GeoFlow brings 3D geographical visualisation to Excel 2013

The other week, Microsoft announced GeoFlow for Excel 2013 at the SQL PASS Business Analytics conference in Chicago. While it’s not exactly new, it is at least, a pretty impressive looking addition to the data visualisation toolkit.

However, while GeoFlow finally brings 3D geographical visualisation to Microsoft’s self-service BI utility belt (in your face, Batman), it’s hard to make a case for it for any purpose except wowing executives and potential clients.

read more
Microsoft BI 2012: A Year In Review
Development Microsoft BI 2012: A Year In Review

With the year drawing to a close, I thought it would be the perfect time to recap the major developments in Microsoft Business Intelligence throughout 2012. Unsurprisingly, the launch of SQL Server 2012 proved to be the focal point of this year’s releases, although we had a few extra surprises along the way:

read more
Development Calculate the difference between two dates in DAX

Another quick Data Analysis eXpressions (DAX) update, given that I’ve been playing about with PowerPivot again this week. Following on from my exertions trying to work out how to return a month name in DAX, I found myself looking for a DAX equivalent of SQL Server’s DATEDIFF function. Fortunately, this is reasonably straightforward. All we need to do is perform a regular subtraction on two dates and multiply the result by 1.0, which will return the number in serial date-time (the number of days since “1900-Jan-0”, which is how Excel stores dates).

read more
Development Calculating Month Name from a Date Integer in DAX

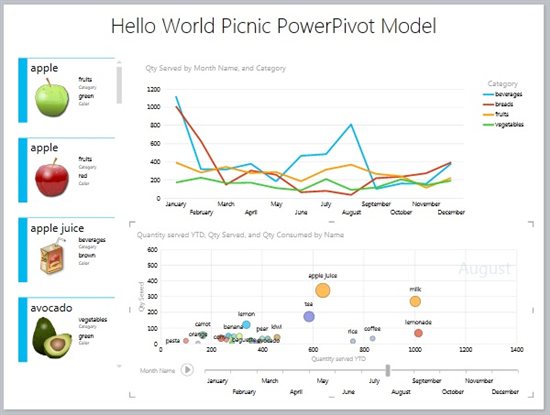
I’ve been playing about with PowerView and PowerPivot recently, while also getting used to the Analysis Services (SSAS) Tabular model in  SQL Server 2012 (Denali). The tabular model provides a high-compression, in-memory store for easy data model construction and analysis. Ad-hoc calculated fields can be defined within PowerPivot (built on the same xVelocity technology) using Microsoft’s Data Analysis eXpressions language, which is very similar to Excel functions. However, DAX is still pretty basic in some places, and while looking for a simple Month Name function (similar to the GetMonthName function in .NET) I ran into a couple of interesting issues.

read more
How To Connect SSRS Report Builder to a PowerPivot Excel file (Sharepoint)
Development How To Connect SSRS Report Builder to a PowerPivot Excel file (Sharepoint)

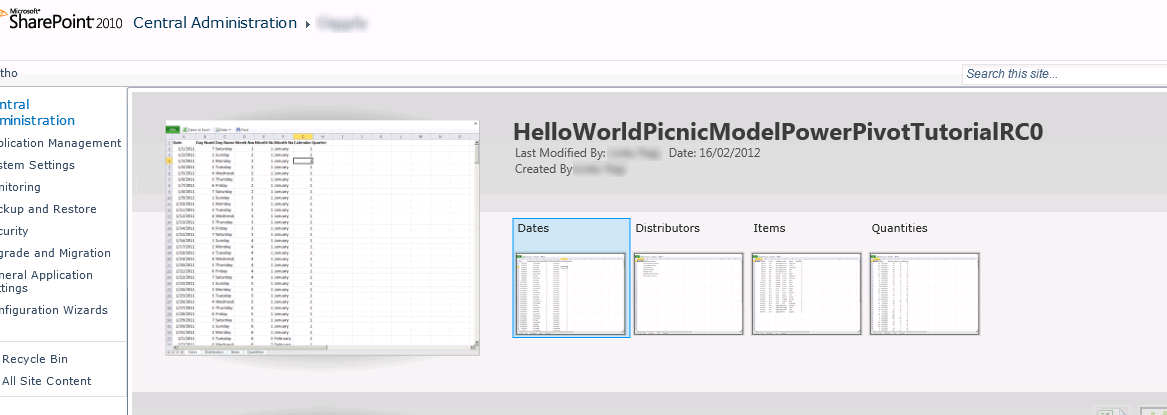
So, you’ve finally got around to setting up that SQL Server 2012 environment and you’re playing about with PowerPivot and SQL Server Analysis Services.  You’ve set up your sharepoint site and you’ve created and uploaded a new spreadsheet using PowerPivot that contains all that tasty cube data.  However, in your haste, you haven’t set up SQL Server Reporting Services Report Builder on the Sharepoint site, so when you open Report Builder on a separate server (or from a local install), and want to connect into your new quasi-cube (via your PowerPivot Excel file), how do you do it?  The Report Builder side of things is not too dissimilar to using a traditional SSAS cube as a Data Source.

The answer, is deceptively simple if you know where to look.

read more

About

picnicerror.net is a personal blog where I post various ideas, thoughts and discoveries through both my day to day work in marketing technology and general hobbies and interests.

Know More

Tag

Social