You’re not a real Data Engineer if you use no or low code tools

I tend to read a lot of posts online to keep up with developments in the data industry. This usually consists of keeping an eye on the data engineering subreddit, people I follow on Twitter (no, I’m not calling it “X”, that’s stupid), my LinkedIn network and data topics on Medium. I find this gives me a good blend of opinions and content to keep up to date with things (even if my reading list on Medium is getting wildly out of hand). One thing I find interesting is there seems to be a sense of elitism from some in the community who are quite vocal about what they perceive a Data Engineer to be (or not to be).

...

Microsoft BI 2012: A Year In Review
Development Microsoft BI 2012: A Year In Review

With the year drawing to a close, I thought it would be the perfect time to recap the major developments in Microsoft Business Intelligence throughout 2012. Unsurprisingly, the launch of SQL Server 2012 proved to be the focal point of this year’s releases, although we had a few extra surprises along the way:

read more
Development Time Format on non-Date Dimensions in SSAS

I ran into a rather strange situation recently while attempting to set up some new calculated measures in an SSAS cube. I’m still new to MDX, so I ended up chasing my tail around for a while (and crying out for help on both StackOverflow and MSDN) before I eventually tracked down the culprit and solved the issue. Basically, I was trying to create a calculated measure, which, using a couple of date attributes from one dimension, would apply to my [Time] dimension and filter the value of a specified measure to match. Not hard, right?

read more
Gaming 10 Years of Xbox LIVE Infographic

Love them or hate them, there’s no escaping infographics these days. They are EVERYWHERE. Personally, I’m a fan. I’ve always been interested in visualisation techniques and better ways to represent data visually. After all, the human brain can process images and patterns much faster than it can text. The best visualisations are the ones that need no explanation, while the worst are the ones that basically just overlay some text or numbers on some graphics and still make you read the content to understand what’s going on. Even then though, I’m a sucker for a nice infographic (yes, event the overly textual ones).

Anyway, the point of this post was to show off a little infographic that I received from Xbox LIVE Rewards the other day to celebrate 10 years of Xbox LIVE, and illustrate my contribution to that:

read more
Microsoft’s Mobile BI “Project Helix” Unveiled
Development Microsoft’s Mobile BI “Project Helix” Unveiled

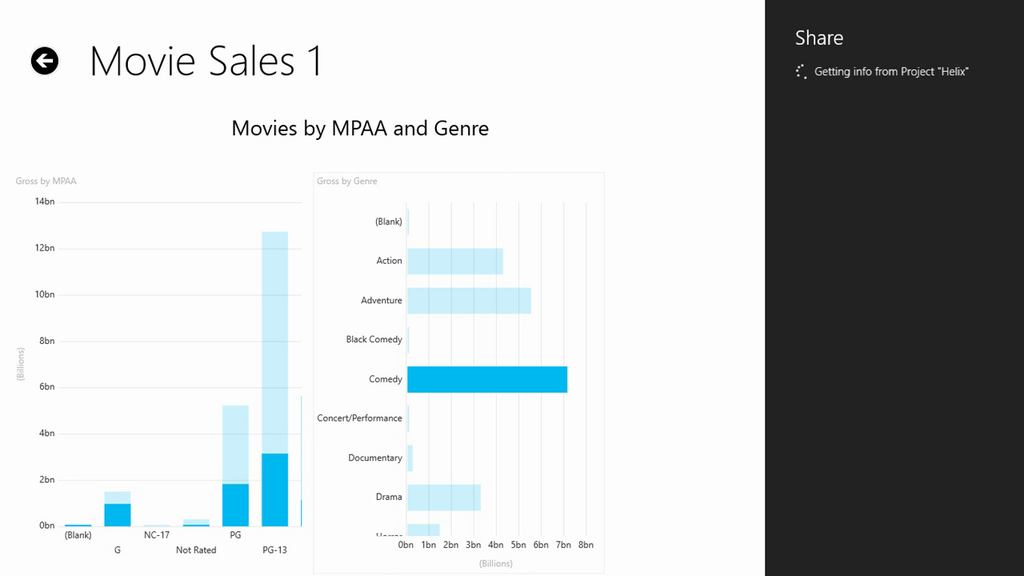
Some pretty interesting information leaked out of last week’s SharePoint Conference 2012 regarding Microsoft’s upcoming Mobile BI (Business Intelligence) solution. There’s been surprisingly little reaction to the unveiling of the solution, apparently codenamed “Project Helix”, perhaps due to the fact that it was unveiled at a SharePoint event and not a SQL Server one. However, courtesy of one attendee tweeting some screenshots to SSAS guru Chris Webb, this little nugget of information landed in my inbox this morning and immediately piqued my interest. Unfortunately there’s very little information available on “Project Helix” at the moment, but from the 2 screenshots provided by attendee Just Blindbaek, there are a few things that are immediately apparent, and a couple more that can be reasonably inferred:

read more
Development Editing a PowerView RDLX file in Sharepoint 2010

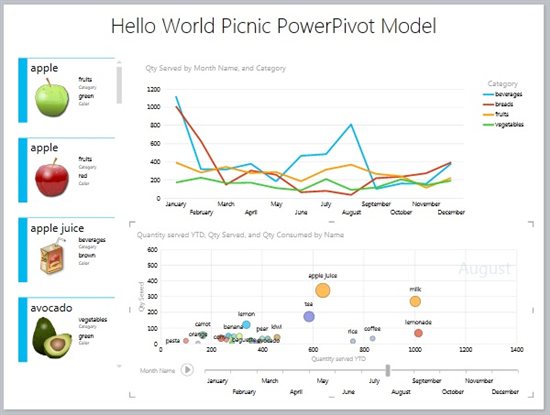
Since I’ve not managed to get a post written up in about a month, I figured it was well past time to pull my finger out and get something posted.  As part of my recent work with PowerPivot and Sharepoint 2010, I’ve also been playing about with PowerView as a quick UI. For anyone who hasn’t tried/heard of PowerView, I suggest checking it out here.

Although a PowerView report is actually run as a Silverlight object when viewed in your browser through Sharepoint, you’ll see if you choose to download the file that it is actually saved as a .RDLX file, remarkably close to the standard SSRS (SQL Server Reporting Services) report file format of .RDL. So, this suggests there might just be some similarities in there somewhere, right?

read more
Development Calculate the difference between two dates in DAX

Another quick Data Analysis eXpressions (DAX) update, given that I’ve been playing about with PowerPivot again this week. Following on from my exertions trying to work out how to return a month name in DAX, I found myself looking for a DAX equivalent of SQL Server’s DATEDIFF function. Fortunately, this is reasonably straightforward. All we need to do is perform a regular subtraction on two dates and multiply the result by 1.0, which will return the number in serial date-time (the number of days since “1900-Jan-0”, which is how Excel stores dates).

read more
Development Calculating Month Name from a Date Integer in DAX

I’ve been playing about with PowerView and PowerPivot recently, while also getting used to the Analysis Services (SSAS) Tabular model in  SQL Server 2012 (Denali). The tabular model provides a high-compression, in-memory store for easy data model construction and analysis. Ad-hoc calculated fields can be defined within PowerPivot (built on the same xVelocity technology) using Microsoft’s Data Analysis eXpressions language, which is very similar to Excel functions. However, DAX is still pretty basic in some places, and while looking for a simple Month Name function (similar to the GetMonthName function in .NET) I ran into a couple of interesting issues.

read more
Manchester City FC Analytics make OPTA data publicly available
Data & analysis Manchester City FC Analytics make OPTA data publicly available

In a move to stimulate the analytics community, Manchester City Football Club have teamed up with English Premier League statistics provider OPTAPro to release a full data set of Premier League players for the 2011-2012 season. The MCFC Analytics project has been created to harness some of the amazing talent out there in the analytics community and provide fresh ways of analysing OPTA’s performance data.

read more

About

picnicerror.net is a personal blog where I post various ideas, thoughts and discoveries through both my day to day work in marketing technology and general hobbies and interests.

Know More

Tag

Social