How To Connect SSRS Report Builder to a PowerPivot Excel file (Sharepoint)
So, you’ve finally got around to setting up that SQL Server 2012 environment and you’re playing about with PowerPivot and SQL Server Analysis Services. You’ve set up your sharepoint site and you’ve created and uploaded a new spreadsheet using PowerPivot that contains all that tasty cube data. However, in your haste, you haven’t set up SQL Server Reporting Services Report Builder on the Sharepoint site, so when you open Report Builder on a separate server (or from a local install), and want to connect into your new quasi-cube (via your PowerPivot Excel file), how do you do it? The Report Builder side of things is not too dissimilar to using a traditional SSAS cube as a Data Source.
The answer, is deceptively simple if you know where to look.
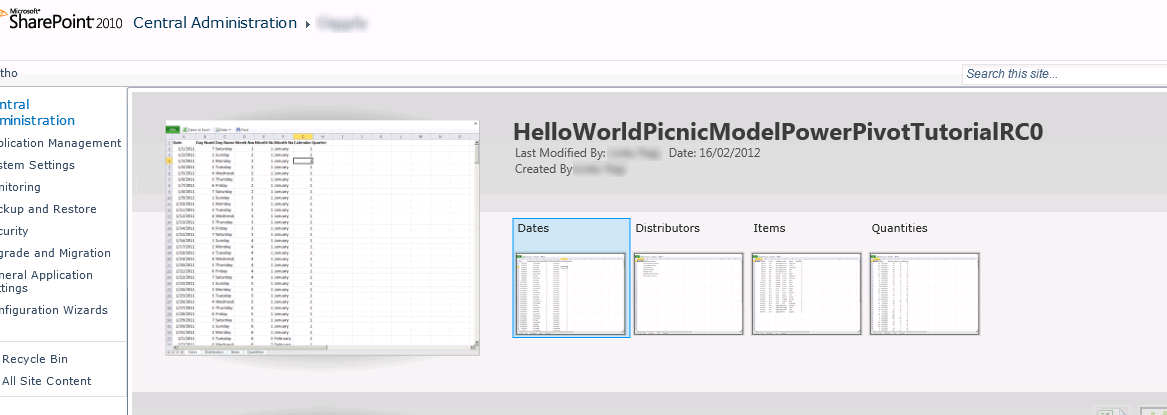
First off, browse to the location of the uploaded Excel PowerPivot file in your Sharepoint site. Your file will appear in the list something like this:

An Excel PowerPivot file listed in Sharepoint
From here, you can simply click on any of the named sheets to open it within your browser (as long as you’re using IE of course).
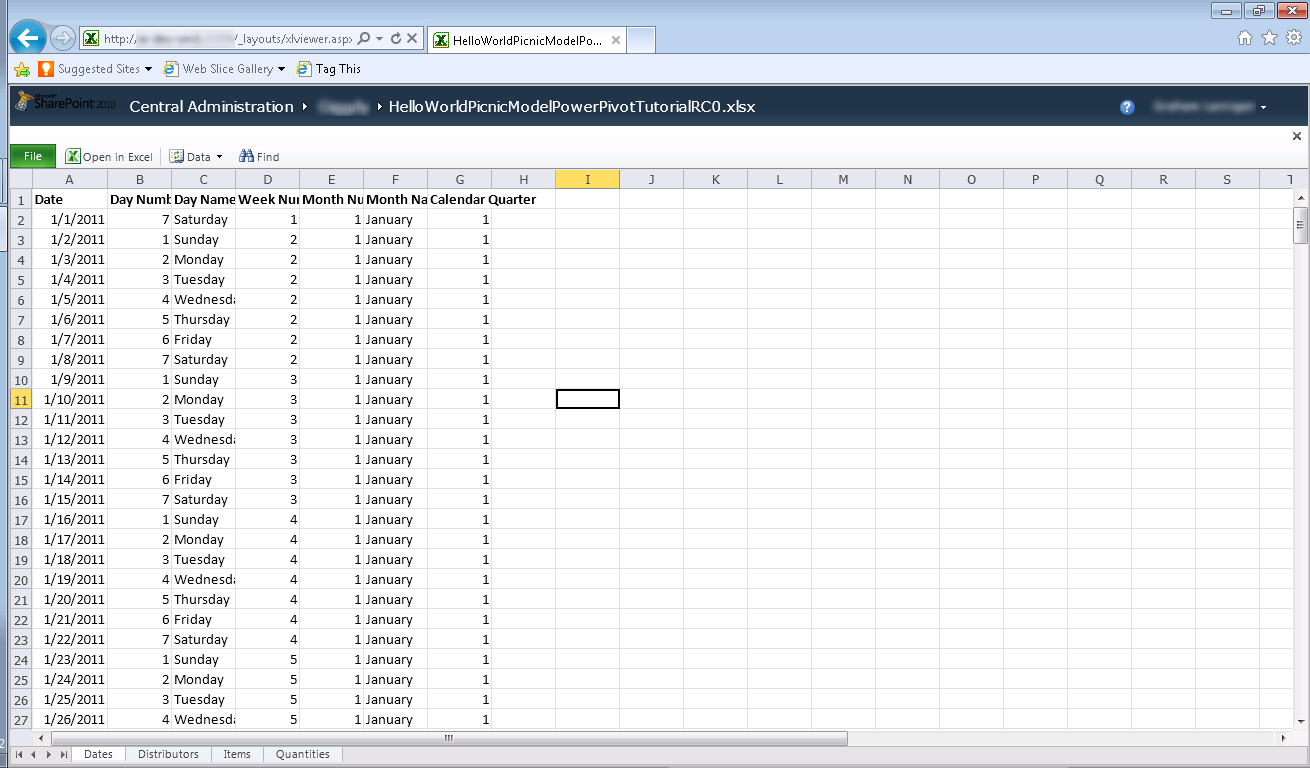
Viewing your PowerPivot Excel sheet in the browser
The URL to open your Excel document directly will be something along the lines of:
http://servername:portnumber/SiteName/YourExcelDocumentName.xlsx
If you want to double check this, you can grab the URL from the IE address bar. The URL will be in a format like:
http://servername:portnumber/_layouts/xlviewer.aspx?id=http%3a%2f%2fservername%3aportnumber%2fSiteName%2fYourExcelDocumentName.xlsx &Range='WorksheetName'!A1&DefaultItemOpen=1
The part we’re interested in for Reporting Services is the “id” parameter, as this contains the path to our Excel document. If you grab that out, and decode the URL encoded parts ("%3a" being “:” and “%2f” being “/”), you should have a similar URL to the one mentioned first above.
Add a new Data Source to an RDL
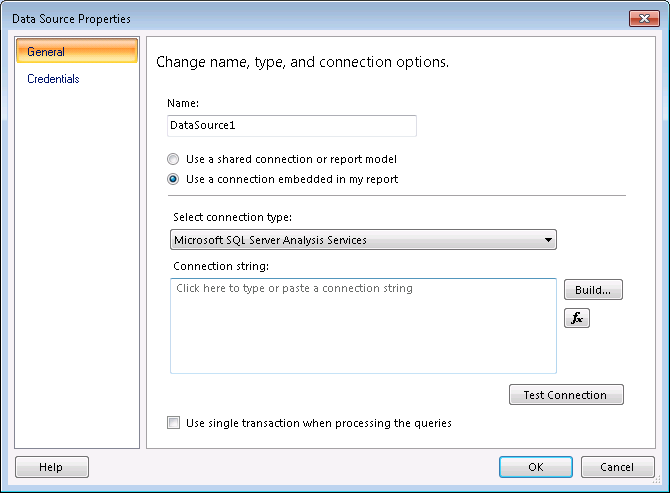
So now that we have the URL for our Excel file, we can use that in Report Builder or SQL Server Developer Tools (formerly BIDS) to create an SSRS data source. Let’s stick with Report Builder for now, although the steps should be the same in SSDT/BIDS. Open your report and right-click “Data Sources”, selecting “Add New Data Source” in the context menu.
Select “Microsoft SQL Server Analysis Services” in the “Select Connection Type” menu and hit “Build…” to configure the connection.
In the Connection Properties dialogue box, we can paste the Excel file’s URL that we worked out above into the “Server name” box. Leave the authentication details blank and check out the “connect to a database” box.
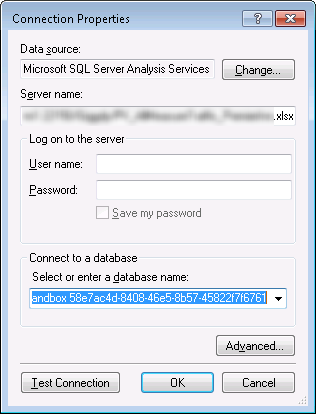
Excel PowerPivot connection properties dialogue box
You’ll see that a “sandbox” database name will appear, which will have a GUID after it. This is the auto-generated name for the cube created when your PowerPivot enhanced Excel file was published to Sharepoint. Therefore, using this connection, you can access the data you manipulated in your file, including any calculations you defined using MDX, or any data you pulled into the file from other data sources outside an SSAS cube.
Be sure to leave the authentication details blank at this stage. Hit “Test Connection” to ensure it all works and “OK” your way back to the report.
Finally, right-click on “Datasets” in the report designer and select “Add New Dataset” on the context menu. Now, when you select your PowerPivot datasource, you’ll again be prompted for authentication details. This time, select Windows Authentication to allow your domain account to handle the access to the data.
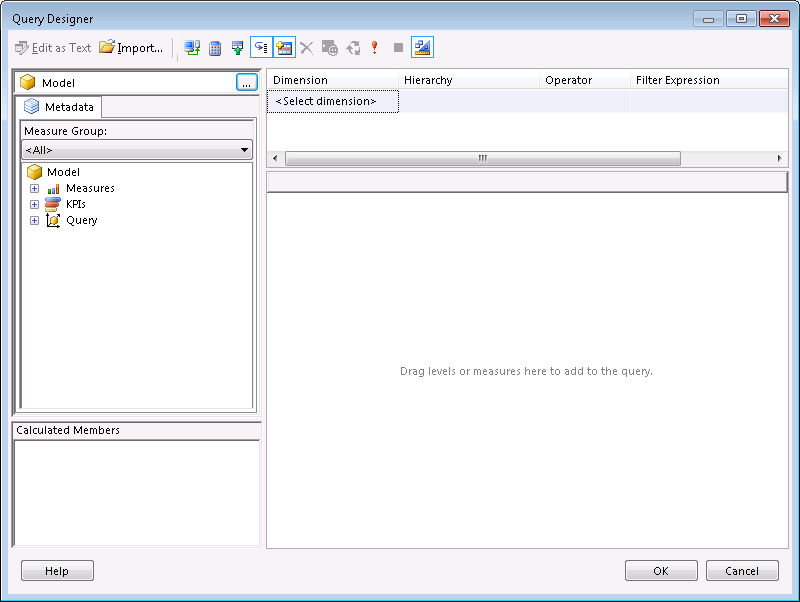
The common interface for SSAS query designer
Click “Query Designer” to access the familiar SSAS interface and configure your dimensions, measures and filters for your Dataset.
And that’s all there is to it. Nothing too fancy, but something I’ve been asked about a number of times when getting people up and running using PowerPivot with Sharepoint and Report Builder.
Have you come across an easier/alternative way to do this or do you have any questions or pointers about this method? Please comment below, I’d love to hear about other people’s experiences with the technology.