Impressions of Microsoft’s new-look Power BI
A couple of months ago, Microsoft’s new-look Power BI Preview rolled out globally. Ditching the Office 365/Sharepoint Online requirement, the new Power BI is a streamlined, simplified version of the product that attempts to lose some of the bloat and give users a focussed, easy-to-use, self-service BI platform.
So has it worked?
What was Power BI like before?
The original version of Power BI built upon functionality that had been introduced through Excel, SQL Server, and SharePoint over a few years. Starting with the Power Pivot Excel 2010 add-on, Microsoft introduced Power View to SQL Server 2012/SharePoint 2010, giving the first self-service (Microsoft) BI capability to enterprise (I’m choosing to ignore Report Builder/Performance Point here and focus on the direct roadmap to Power BI).
Shortly afterwards, Microsoft introduced the Power Query add-on for Excel 2010, which brought powerful ETL tools into the stable, allowing power users to gather their own data and mash it together with their in-house systems.
With the launch of Excel 2013, Microsoft integrated Power Pivot, Power Query, and Power View (as well as the new Power Map) into one place, and started connecting the dots between the components, allowing users to shape data in Power Query, model in Power Pivot, and visualise in Power View, all within Excel. Again, the sharing aspect of this was handled by SharePoint, which allows users to upload their workbooks and share them with their organisation.
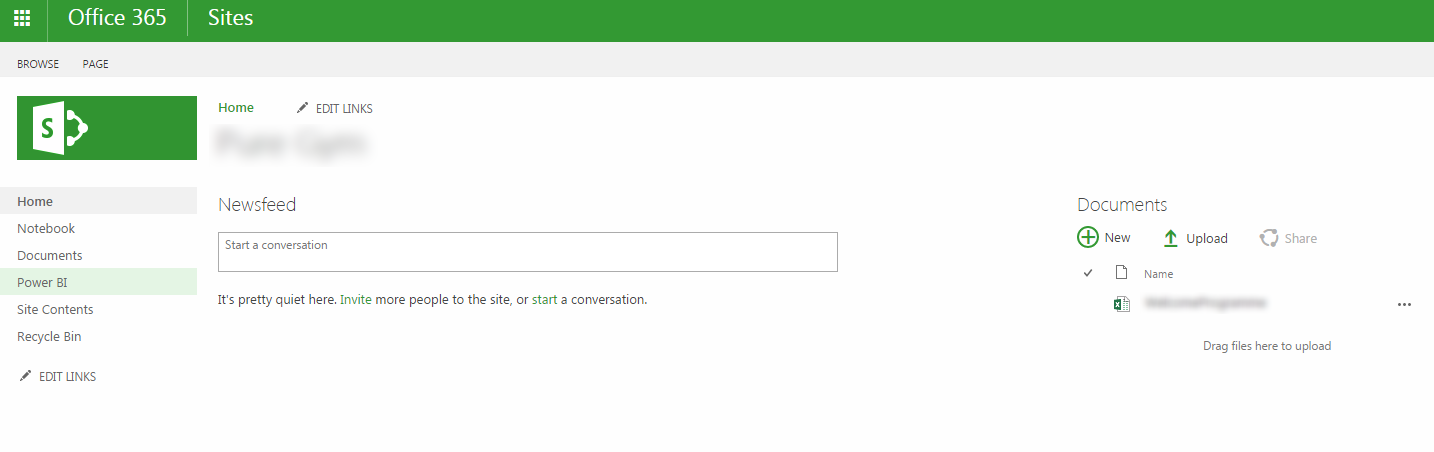
SharePoint Online adds a lot of additional content before you get to a Power BI site
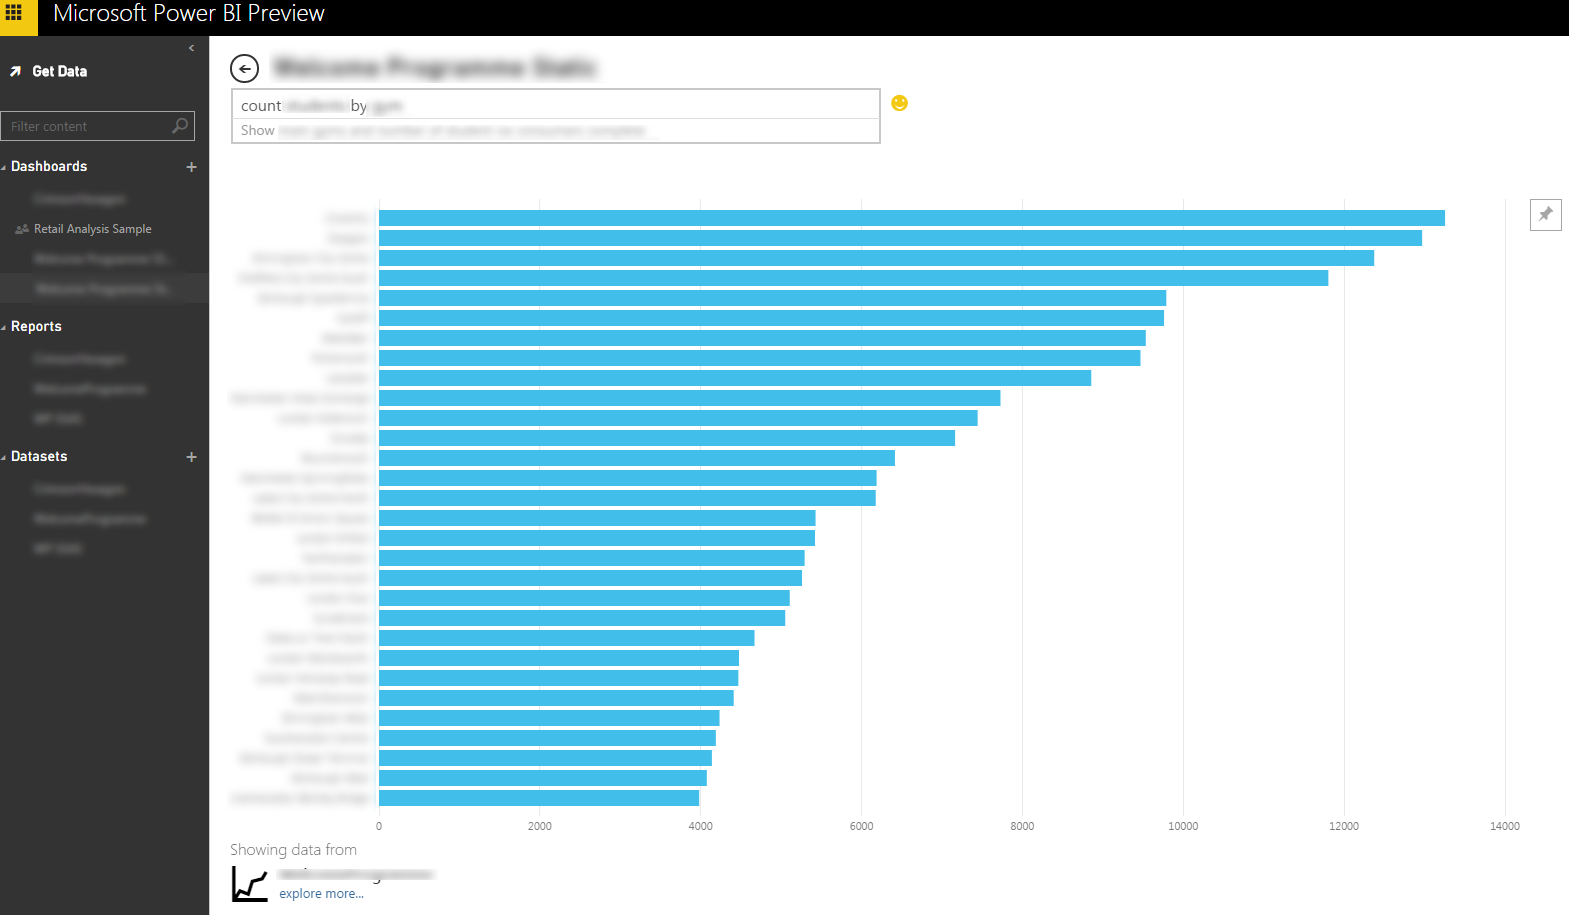
A natural extension of this, Microsoft decided to offer a cloud-based version of the same functionality. Removing the costly SQL and SharePoint licences (not to mention hardware costs), they offered a “per-user” cloud option using Office 365 and SharePoint Online. This brought a lot of the same functionality available to enterprise within the reach of small teams/businesses and solo users. It also allowed the addition of killer new features, such as Q&A, a Natural Language Query function that produces visualisations on the fly in response to users’ semi-plain English language queries (no SQL/DAX/MDX syntax). Also, the ability to configure Data Management Gateways to on-premise data (and create an OData feed) was a huge addition.
Unfortunately, the drawback with Power BI on Office 365 was the same as with a lot of Microsoft products. Throwing multiple components together and using existing services like O365/SP Online meant that there was a lot of confusion with end users on how to access all the features. Some of the Power BI components and/or features were only compatible with certain versions of Excel, and the reliance on O365/SharePoint Online meant you had to dig through a lot of extra content and settings just to get your Power BI site up and running.
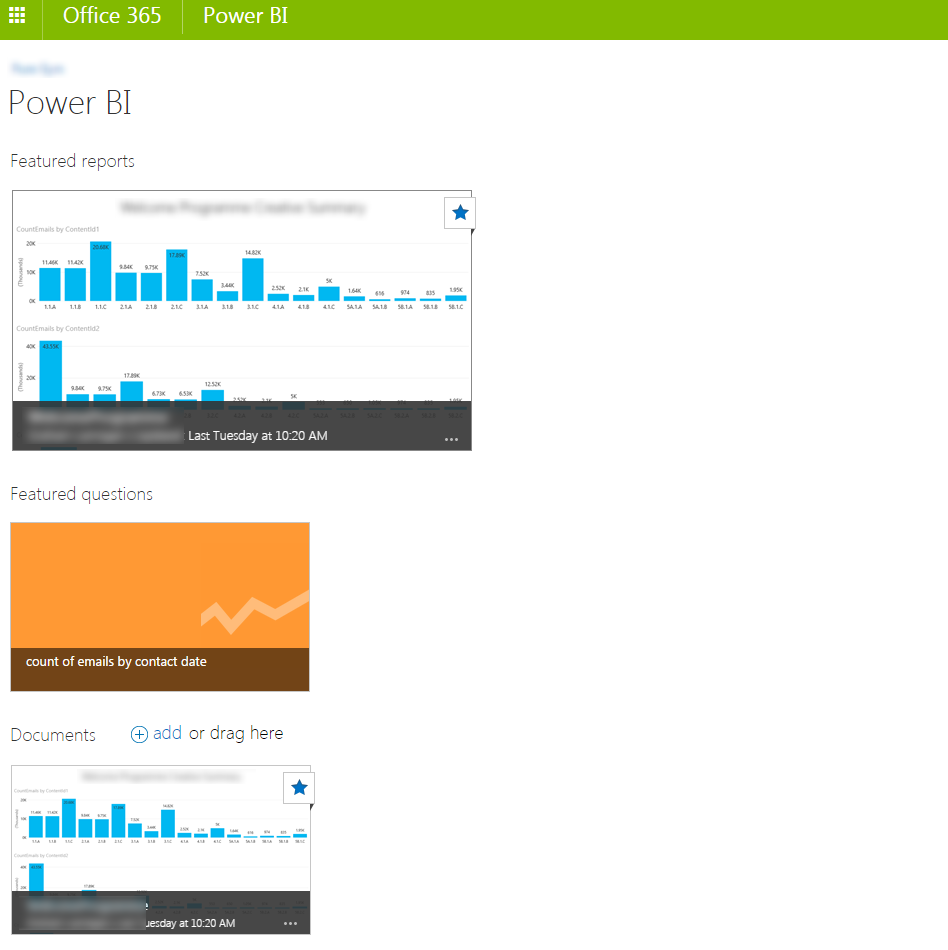
Power BI sites on Office 365 are nice, but have limited functionality online
SharePoint’s a great bit of kit when used correctly, but when it comes to self-service BI, the original Power BI was miles behind the likes of Tableau and Qlik in terms of simplicity and ease of access.
Goodbye Eric Stoltz, hello Michael J Fox - Enter the new look Power BI.
What’s good about the new Power BI?
Microsoft has been very good at listening to their customers recently, asking for user feedback on everything from SQL Server to Xbox. They agreed that Power BI needed to be as simple as possible for new users, so they set to work removing barriers and creating a streamlined, dedicated service.
Ditched SP Online and Office 365
Removing the SharePoint Online/Office 365 requirement in favour of a dedicated site and pricing structure is a massive step. By stripping out all the bloat, MSFT have created something instantly accessible and cheap.
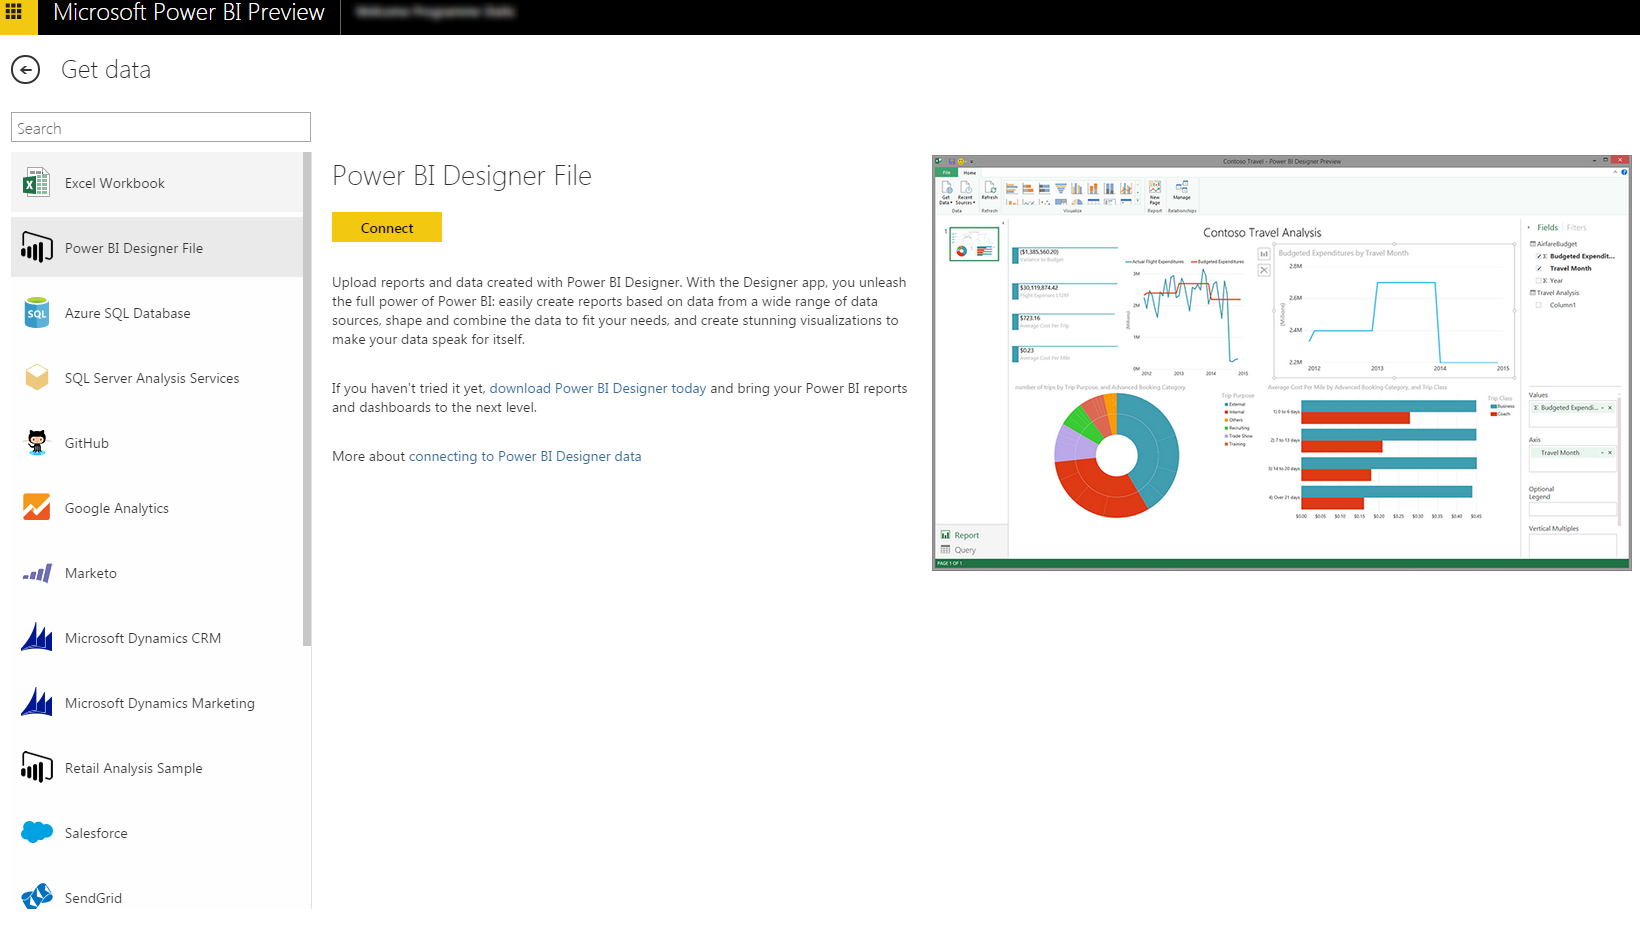
Standalone Power BI Designer
Integrating the Power BI tools into Excel was a very good idea, and fortunately MSFT are continuing to support this. However, they have also recognised that not everybody has the latest version of Excel. To this end, they’ve launched a free, standalone Power BI Designer application that offers much of the same functionality. In fact, the Power BI Designer seems to be basically Power Query, Power Pivot, and Power View, all wrapped into a shiny new UI.
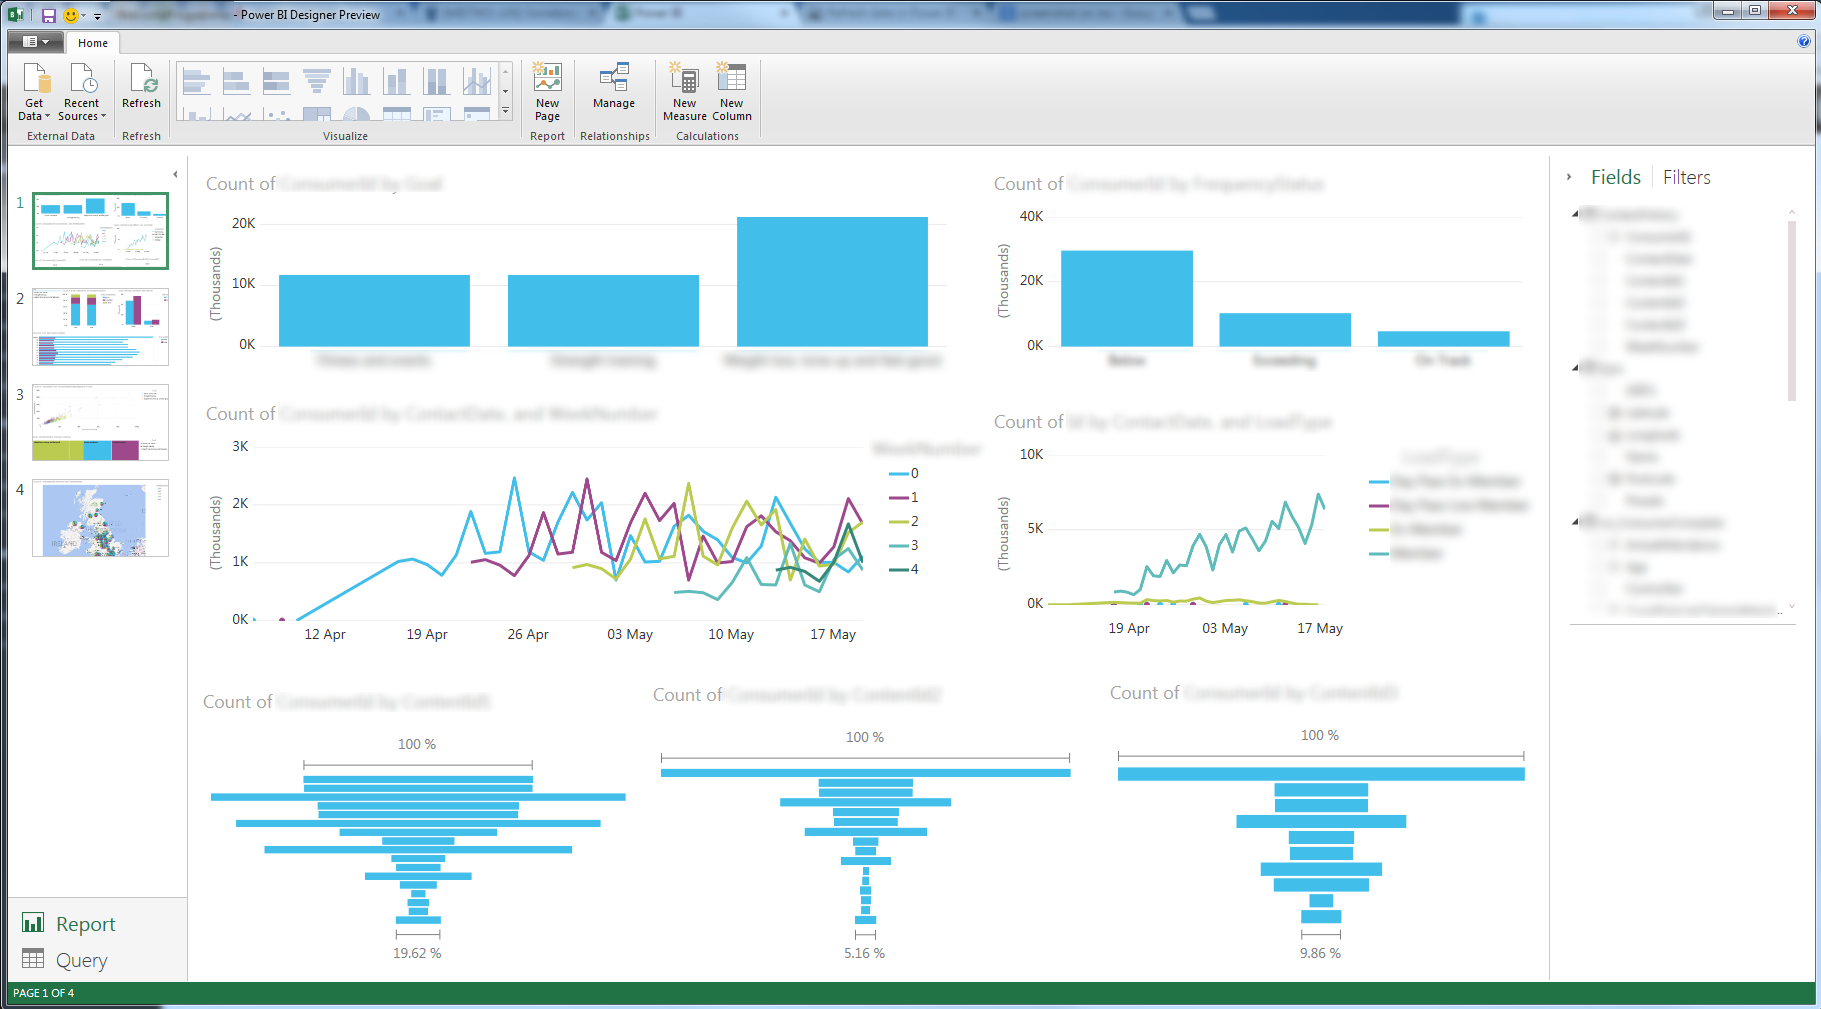
The designer creates a proprietary file format (.pbix), which can be uploaded directly to the Power BI website.
HTML5
Silverlight was a massive, massive drawback to Power View, especially considering Google’s withdrawal of support for the NPAPI protocol and removal of Silverlight support from Chrome in September 2015. Silverlight was also a massive barrier to getting Power BI running on mobile and Internet of Things (IoT) devices.
To their credit, MSFT had experimented with HTML5 in Power BI on Office 365, but it was never anything more than a beta.
With the new Power BI, MSFT have fully embraced HTML5, which opens up huge possibilities for accessing data regardless of location. Which leads me nicely on to…
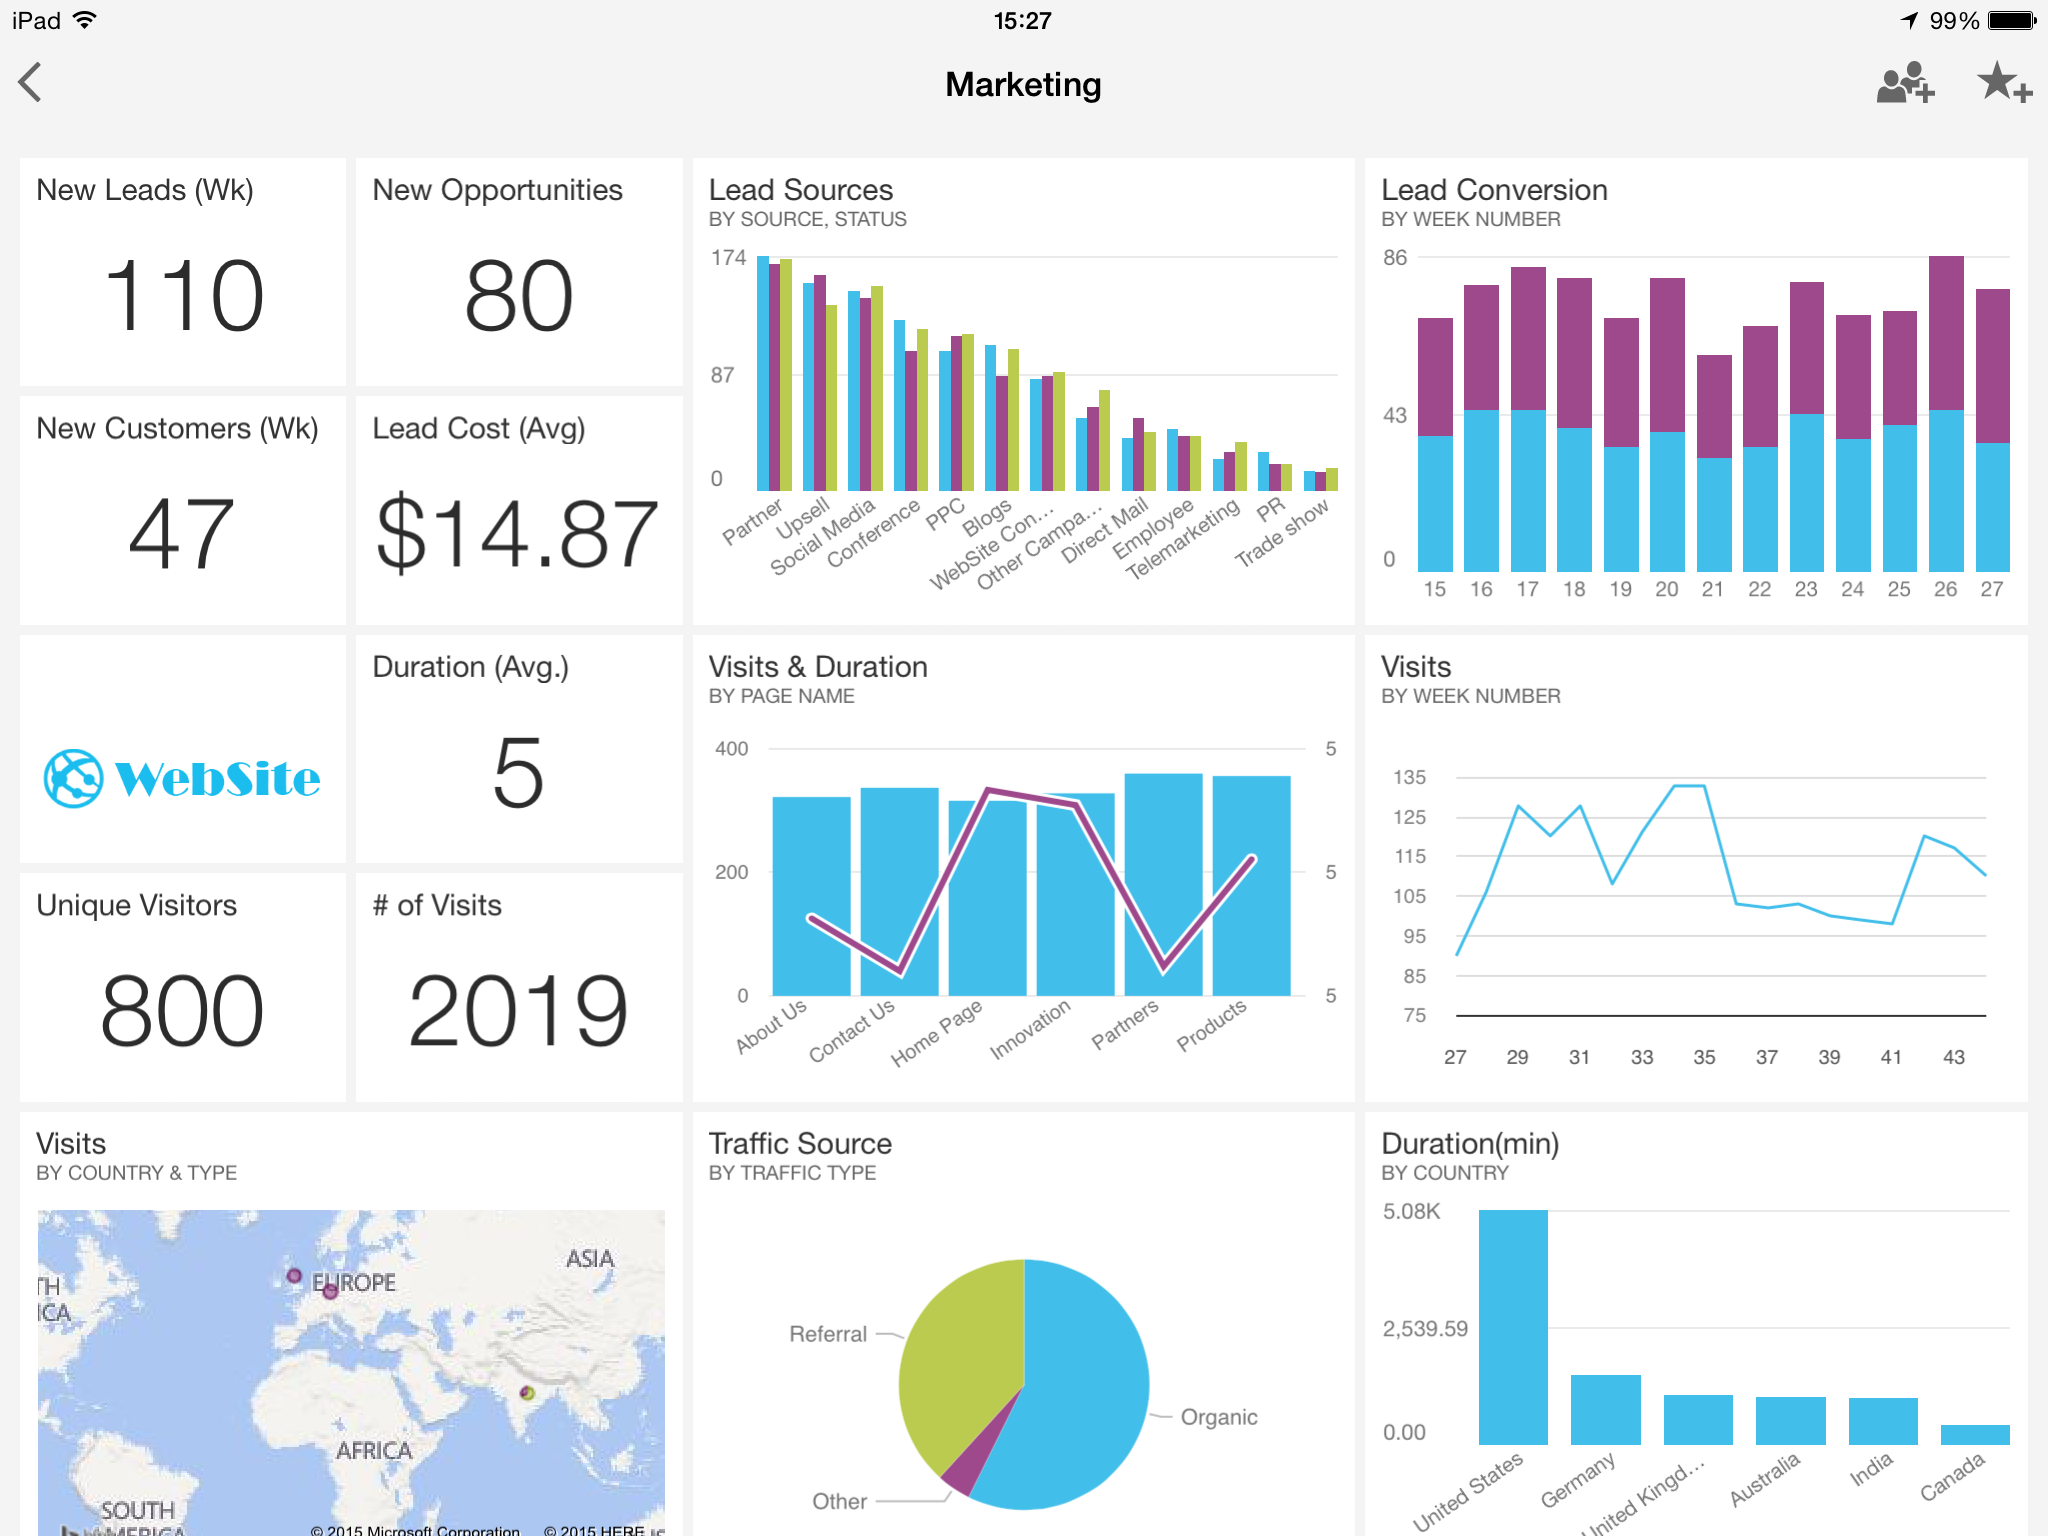
Mobile app
In a rather bold move, MSFT has launched a Power BI mobile app, leading on iOS. Eschewing their own Windows Phone platform, MSFT listened to their customers, who said that they would be most likely to have Apple devices. The mobile app is available now, and allows viewing of all up-to-date dashboards and reports, and pin any visualisations across all their content to the homepage as a favourite.

There are plans to support more platforms, but by launching with iOS first, MSFT has really let their head rule their heart and made a smart decision.
User Measure/Field creation
One of the drawbacks with the previous iteration of Power View (in Excel/SharePoint) is that you can’t directly add new measures. To define new calculated measures or columns, you have to go back to Power Pivot and define them there.
The new Power BI Designer allows users to define new calculated measures and columns directly on the Power View interface, meaning that users can quickly create new fields on the fly using DAX, and play with data types and formatting. This adds a key function that Tableau and Qlik have been doing for some time.
Customisable dashboards
The addition of separation between Reports and Dashboards is a very nice touch. Previously, a user would build a Power View using the data in their model, and everyone would have to stick with the same Power View with all the visualisations selected by the creator, or edit it themselves.
With the new Power BI, the creator builds a Report containing the data and a number of visualisations. Subsequent users can then pick and choose which of these visualisations they wish to use by adding them to Dashboards. Dashboards can mix and match data from multiple sources and Reports, meaning you can combine data from Google Analytics with streamed data from your web logs if you wish! Oh, and if your data source is stored in the cloud (uploaded Power BI/Excel file, Azure etc), then you can explore the data in Natural Language via Q&A and pin the results to your dashboard.
You can then share Dashboards with other users straight from the UI.
More visualisations
This is a very quick point, but MSFT are regularly adding more and more visualisation types to Power BI, meaning its constantly evolving and expanding.
Active support and update programme
Finally, one of the most exciting things about the new Power BI is the rate at which it is being updated. There’s a vocal support forum where MSFT are actively engaging with users and asking them to share what they’d like to see next, vote on previous submissions, and updating users on planned developments.
They’re also making rolling monthly updates to both the main Power BI website, and the Power BI Designer, constantly adding new data sources and functionality.
What’s not so good?
Inevitably with a new, immature product, there are some glaring omissions. The good news is that MSFT is aware of a lot of the drawbacks and appears to be working hard to add new functionality.
Limited Data Refresh
The biggest gripe I have currently is the limited data sources that support refresh. At the time of posting, you can only automatically refresh your data if it resides in an uploaded Excel file that uses Power Query to load cloud-based data, or an on-premise SSAS Tabular model with a gateway configured. If they can add in other sources for direct refresh from on-premise systems like SQL Server, SSAS Multi-dimensional, and other DB systems, it’ll be much more useful for serious work.
Limited Q&A Support
Perhaps unsurprising this one, but the Q&A Natural Language Query functionality can only run on cloud-based data sources, or data that resides in static uploaded Power BI Designer (.pbix) files.
Support for Q&A is limited to cloud data sources.
It would be good to see Q&A support for live data sources like on-premise SSAS Tabular.
No Export Function
No matter how nice a web application you build, the inevitable question always comes up: “Can I export this report to Excel?". In fact, there’s currently no export functionality in Power BI at all.
Given how great SSRS is at exporting reports, it would be nice to see even a subset of that in Power BI, say export to Excel, PDF, and Image. Clients always seem to want to email their reports around.
Interactive Tiles on Dashboards
The customisable dahboards are really nice. However, the tiles are static. By that, I mean that they don’t have nice tooltips when you hover over a data point, and you can’t click to filter the visualisation (okay, that one’s probably fair, given that a dashboard can cover multiple unrelated reports).
I really like the cross-visualisation filtering in Power View though, so I hope MSFT find a way to get this working.
Still in Preview
The main drawback with Power BI is simply that it’s an immature product that’s still subject to massive change. As such, I wouldn’t recommend betting the farm on it instead of something like Tableau, Qlik, or more traditional enterprise BI tools. However, it’s made an incredibly strong start, and if MSFT continue to listen to their customers and update Power BI as regularly and as quickly as they have been, they could be on to a real winner.
Power BI supports an ever increasing array of data sources.
Summary
The new incarnation of Power BI is looking extremely promising. MSFT have learned from their missteps with Power BI for Office 365 and have launched a Preview that looks like a serious contender in the cloud/self-service BI space. The fact that they’re updating constantly and actively engaging with users on their support forum suggests that they’re committed to delivering a product that people really want. I’d like to see some of this approach make it to on-premise BI too, stripping out the bloat and making things easier for clients to get involved.
Early signs are very encouraging though, and I’ll be keeping tabs on Power BI over the coming months to see how it progresses.
Let me know in the comments below if you’ve tried Power BI, and what your thoughts were. And get on over to the Support forums at https://support.powerbi.com/forums/265200-power-bi and tell MSFT what you want to see!