How To Create Multi-Column Lists in SQL Server Reporting Services (SSRS)
I recently encountered a scenario where I wanted to display my report content in the form of a multi-column list. In essence, I was looking to create the SQL Server Reporting Services (SSRS) equivalent of an ASP.NET Repeater, to render my report content both horizontally and vertically (in this case a dynamically repeated SubReport) a number of times dictated by my source dataset. I spent a little bit of time investigating some more complicated possibilities such as building a matrix of row and column groupings when the solution finally hit me. It is simply brilliant in its simplicity. Here’s how to do it.
Set up your SSRS report with a Table for each column you want in your list.
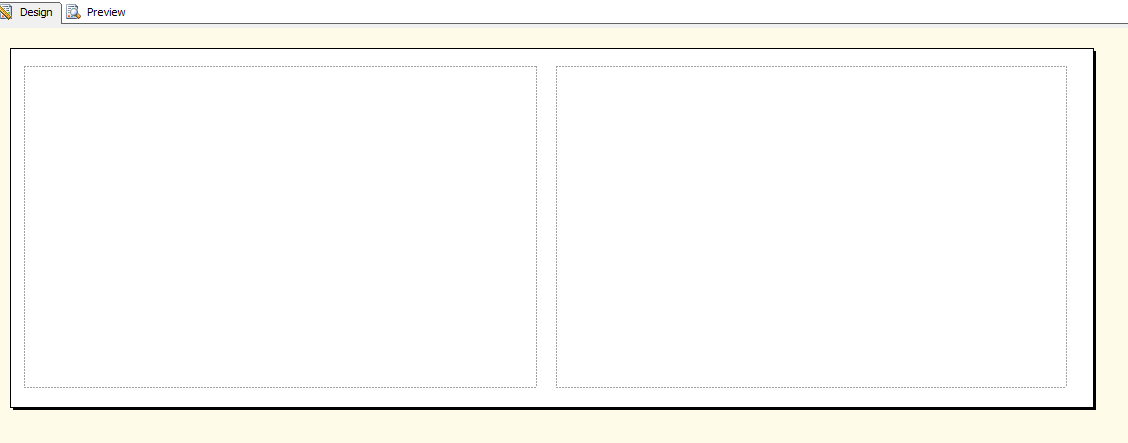
Create your report as normal with whatever other components you need and add your source dataset. Now, for every column that you want to have in your list, add a new Table control. In my example, I wanted to create a 2-column list, so I’ve created 2 Table controls, side by side.
Now that you’ve done that, the next step is to associate both of them with your dataset. This will allow the tables to dynamically generate a single row for every row of data that you’ve returned.
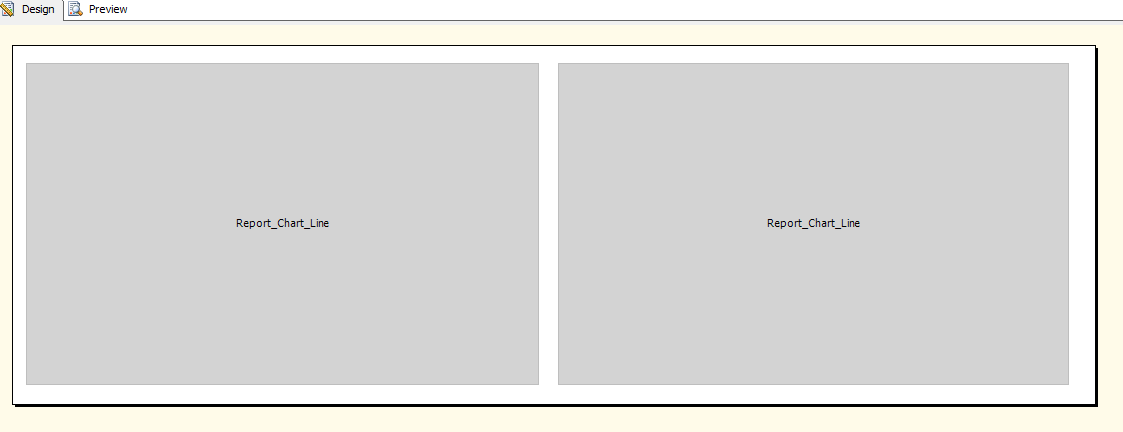
Next up, add whatever content you want to have in your table/list. This could just be a field from the dataset or it could be something a little more grandiose. In my example I’d already created a sub report which contained a Chart control. I was wanting to render _n_charts in 2 columns all the way down the report. As you can see in the next picture, I’ve added my sub report control to each of the 2 tables.

Now I've added my sub report control to both of the 2 tables
If we try to run the report now (assuming you’ve set up any required parameters for the sub report), what you’ll see is 2 columns (tables) each displaying exactly the same data.
The next part is to get the 2 columns to display data horizontally as well as vertically. The secret to this part is not to think about this as a single list but now start thinking of it as 2 separate tables, based on the same dataset (as it really is).
So, right-click on one of the tables and select the “Row Visibility” menu item:
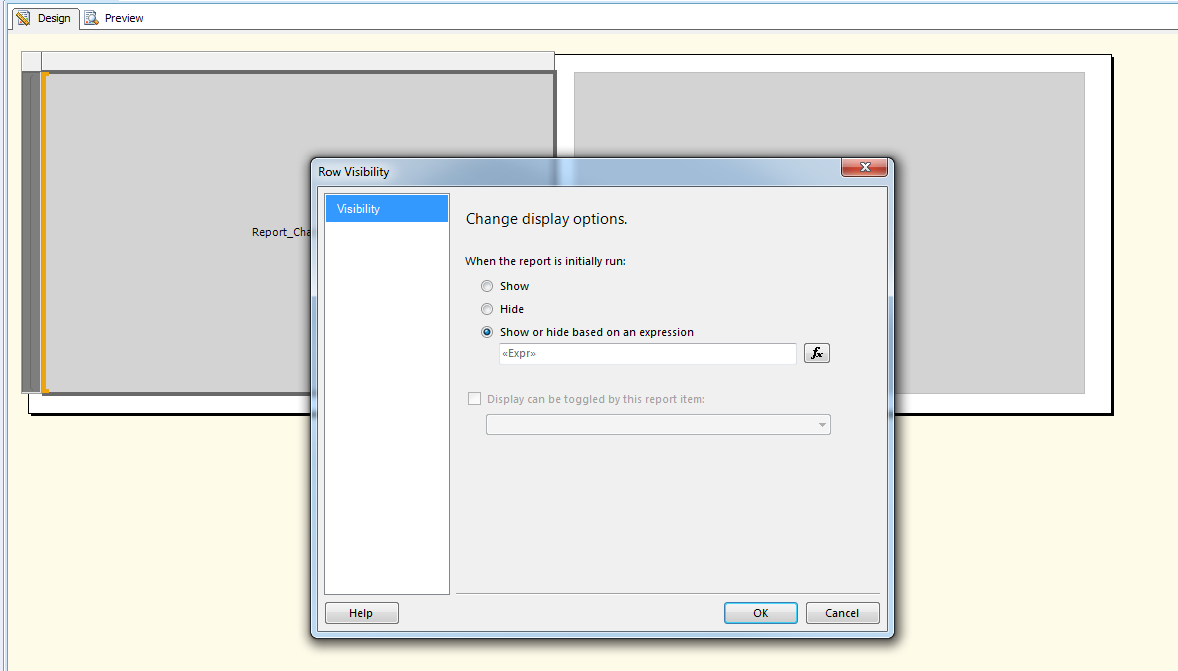
Select the Row Visibility menu item
If this hasn’t given the trick away, I don’t know what will. On the Row Visibility dialogue box, click the “Show or hide based on expression” radio button.
All we need to do now, is enter an expression which will hide the alternating rows on this table. We’ll enter a similar expression on the second table but hiding the other rows which were visible on the first.
Use the Mod function to calculate the modulus to determine which rows to hide. If you’re using 2 columns here, you want to find the modulus of 2, if 3 columns, the modulus of 3 and so on.
If the remainder is 1, we display the row, otherwise we hide it.
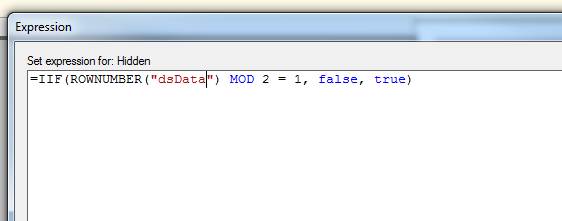
Use modulus to show/hide each row based on the remainder.
For the second table (i.e. our alternating items) we simply need to change the remainder value expected to 0. Therefore the 2nd table will display only the rows that are divisible by 2.
And that’s it. Using this simple method, we can create a de facto list in SSRS by using a little bit of maths and some basic slight of hand. The best part is that because we’re using the same dataset for both tables, we only hit the database once. There is a slight overhead on rendering time in SSRS so I wouldn’t recommend using this for thousands of items but then you really wouldn’t want to create a list of thousands of items anyway, would you?
A simple tip, with impressive results.