How To Connect SSRS Report Builder to an SSAS Cube

I was asked recently how one could use SQL Server Reporting Services (SSRS) Report Builder construct a report using a SQL Server Analysis Services (SSAS) cube as it’s data source. The good news is that is just as simple as connecting to a SQL Server database, there’s really very little difference, at least if you using the GUI route.
- First up, right-click Data Sources and choose “Add New Data Source”.
- On the dialog box, change the “Select connection type” drop-down to “Microsoft SQL Server Analysis Services”.
- Click the “Build…” button to the right. This opens the Connection Properties dialog, where you can enter your server, login and database details.
- Don’t forget to “Test Connection” before exiting.
Once your Data Source is in place, you need to set up your SSAS-based Data Set and specify what data you want to retrieve from your cube:
- Right-click Data Sets and choose “Add New Data Set” to open the dialog box.
- Choose your cube Data Source.
There are two main differences here between connecting to a SQL Server DB or an Analysis Services Cube:
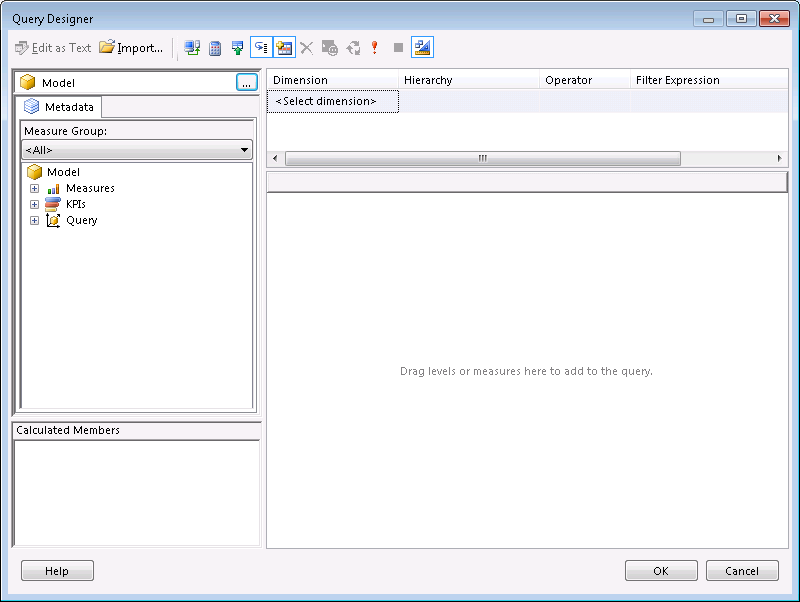
The first is the GUI for the Query Designer itself. With a SQL Server Data Source, the Query Designer allows you to pick from available Tables, Views and Stored Procedures, specify aggregates and apply filters to the results which can also be set as parameters. While the concept is similar with SSAS, the execution and the GUI are both different. The SSAS Query Designer should be familiar to anyone who’s designed a cube in Business Intelligence Development Studio (BIDS) or has browsed one in SQL Server Management Tools (SSMS). It’s exactly the same interface. Using this common Query Designer, you can perform the same operations as with SQL (choose your columns and filters and specify parameters).

The common interface for SSAS query designer
The second difference is the output of the Query Designer. With a SQL Server Data Source, naturally, the query produced will be T-SQL. However, the SSAS Query Designer generates an MDX query. If you’re unfamiliar with MDX, make sure to leave well enough alone, however, if you’re an MDX whizz; a) you probably won’t be reading this post and b) feel free to muck about with this generated MDX to your heart’s content.
And that’s basically it. Things to watch out for here include modifying parameters. When querying an SSAS cube Data Source, the parameters generated are actually MDX expressions, not raw values (like with SQL) so be sure you understand what you’re doing before editing these values.
If you’re taking things one step further and creating SSRS reports in Report Builder based on ad-hoc cubes that you’ve uploaded to Sharepoint using Power Pivot, be sure to check out my earlier article on how to hook this up. A lot of the steps are exactly the same as the above.