6 Reasons why PowerView is the Future of Reporting Services

Since its introduction with SQL Server 2012, PowerView has started to become the familiar face of Microsoft’s self service business intelligence offering. Its inclusion in Excel 2013 has only reinforced its position as the premier tool for quick, interactive visualisation of data, in conjunction of course with the magnificent PowerPivot. But ask any “traditional” BI developer/architect about Reporting Services (SSRS), and it’s likely that they will staunchly defend it, decrying PowerView as a gimmick.
So here are 6 reasons why PowerView is NOT a gimmick, and may in fact be the future of SQL Server Reporting Services.
1 - Built on SSRS
PowerView itself is based on Microsoft’s Silverlight platform, the company’s attempt to make a rich, web front-end technology to rival and surpass Adobe’s Flash. Built on the .NET platform, Silverlight is what enables PowerView’s drag-and-drop functionality and interactive customisation. However, just like the Open XML file formats in Microsoft Office 2007+, PowerView’s RDLX file is actually just a ZIP archive containing a load of other stuff. Dig into it and you’ll see that the archive contains a bog standard Reporting Services RDL file. In fact, you can even play about with some of the content in this file (within reason) to edit the PowerView in ways that you can’t do in the interface. Be warned though, anything that doesn’t sit well with PowerView will corrupt your lovely visualisation.
If you look at the differences between the initial PowerView release (with SQL Server 2012) and the version that shipped with Office 2013, you’ll see that Microsoft have added a few features to allow a little more customisation. Looking at the options available in the PowerView editor, and the properties all feel very familiar to those in Report Builder/BIDS/SSDT, and should be very familiar to an SSRS developer/user.
The next release of PowerView will be very interesting indeed. I’m looking forward to finding out if they continue adding features that exist in SSRS, or if they’ll bring in something completely new.
2 - Easier than Report Builder
Okay, so this argument is probably a little spurious, given that I’ve just said that PowerView’s editing options are similar to Report Builder’s, but cut down. However, the functionality that IS present in PowerView, is definitely quicker and easier to use than those in Report Builder. PowerView takes Report Builder’s office-style icons and ribbon, but the fact that all chart and table creation is drag-and-drop gives the young upstart the edge.
The trick will be to keep this simplicity intact when, or indeed if, Microsoft roll out more of the SSRS functionality into PowerView. At some point, that huge Properties window down the right-hand side is going to have to come into play.
For now though, with no download required (apart from the Silverlight installation) and the fact that you can just edit your PowerView directly in your browser and/or Excel, it’s definitely easier to get to as well.
3 - It’s in Excel
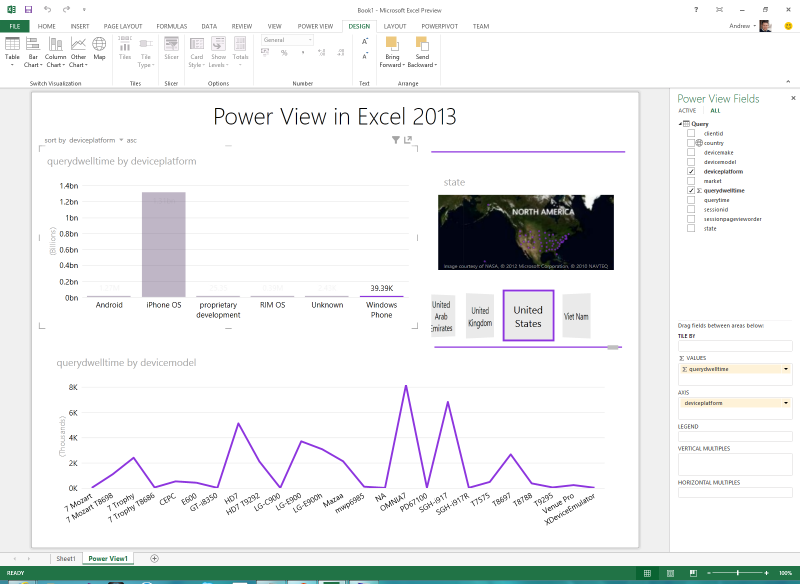
You can create, edit, and view PowerView reports directly in Excel 2013
Ask any analyst or data scientist what is the one tool they couldn’t live without, and chances are they’ll say “Microsoft Excel”. In fact, if they say anything else, I’d be tempted to suggest they’re lying! Microsoft realised pretty quickly that if they were to make any serious headway in this self service business intelligence arena that they had one thing that was in the perfect position to capitalise: Excel. By making sure that they tie their products into Excel, Microsoft are being very clever and putting a lot of power into the hands of the users. Data Explorer, the Data Mining Plugin, PowerPivot, GeoFlow and PowerView are all parts of the BI puzzle that Microsoft has very cleverly tied together by integrating them into Excel.
Personally, I’ve barely touched an SSRS report for months. If I want to mock something up or play about with some data, I’ll always hit Excel first, use PowerPivot to model and then throw together a visualisation in PowerView. It’s so quick, easy, and accessible to everyone. At least for this purpose, why do you need an SSRS developer to take a specification, build a report, come back and refine it, when you can load your data into Excel, create your report, and then send it on to the executive team all within one application?
4 - It’s in PowerPoint
If integrating PowerView in Excel was a nod to the analytical-minded data workers, then this feature was definitely to speak to the, dare I say it, more “magpie-minded” sales and executive types. Everyone was blown away by how awesome PowerView looked when MS first revealed it, but the real kicker for all of those presenting in boardrooms and at conferences throughout the world, is the fact that PowerView can also be embedded in PowerPoint.
Straight from the SharePoint web interface, you can save your PowerView as a PowerPoint presentation, and show off your creations on the big screen. In fact, if you have an active connection to the SharePoint server (A working web connection? During a presentation?) then you can actually filter, slice and explore your PowerView live, within PowerPoint. Very flashy, and very cool if you can get it to work. If you don’t have a web connection, it still degrades nicely into a static image of your PowerView report.
5 - Interactivity
The real wow factor about PowerView is how interactive it is. Hook it up to a data source and you can add controls, fields, filters and aggregations with a click or two. You can bring in external images, sort tables and highlight elements with ease. Everything in PowerView is pretty much instant, thanks to the use of Silverlight. Check out Microsoft’s own demo video from the SQL Server 2012 RC0 reveal.
It’s simply so responsive and interactive, and puts control squarely in the hands of the user, not developers. Compare that to SSRS reports, which are inherently static and require developer input to modify, and you can see why PowerView solves a lot of issues with the traditional SSRS approach.
6 - “Metro”/“Modern UI” Style
Finally, and it’s a minor point, PowerView’s style fits nicely into Microsoft’s Modern UI (formerly known as Metro) design paradigm. From the blocky style, to font used, PowerView looks like it came straight out of the same design shop as Windows 8, Windows Phone 8, and the Xbox 360 dashboard. Yes, you can replicate this in SSRS, and it’s not exactly a clincher, but it speaks towards Microsoft’s intention to push PowerView as the reporting component of their BI offering.
Conclusion
There will always be room for enterprise-level reporting, and in fact, the self-service vs enterprise argument has been done to death (check out Chris Webb’s blog for a great post about it). But it makes sense for Microsoft to ensure that its reporting offering remains up-to-date and accessible. Add in the fact that there’s been very little movement on new features for “traditional” SSRS, and it seems clear that Microsoft intends to move their reporting focus to something quicker and easier to produce, just like PowerView.
Agree/disagree with any of my points above? Have something you want to add to the discussion? Please leave your thoughts in the comments below. I’m really interested to hear from SSRS developers out there on what their thoughts are. As a follow-up to this post, I’m working on the counter-argument as to why SSRS is still needed and can’t be replaced by PowerView. Keep an eye out for that one coming soon.