Power BI for Office 365 first thoughts
I’ve been meaning to write something on Power BI for a long time now, and I’m a little late in getting round to writing this, as most of the dust has already settled after Microsoft sent out the first round of invites to the Power BI for Office 365 preview, and a lot of people have produced some amazing work with Power BI. Chris Webb has written a pretty comprehensive review on his blog, as have countless others.
What is Power BI?
For anyone living under a rock (or new to the world of MS BI), Power BI is a new offering from Microsoft which makes their new Excel-based self-service BI tools shareable and collaborative in a way that was previously only available for organisations rocking a SharePoint Enterprise installation. By hooking their toolkit up to Office 365, they’re providing a cloud-based ecosystem in which to share, manage and explore data, using their suite of data tools: Power Query (formerly Data Explorer), Power Pivot (formerly PowerPivot), Power View, and Power Map (formerly GeoFlow). If you want to know a bit more, I’ve got a more detailed post on the included functionality in Power BI for Office 365.
Sounds good - how do I get in on this?
You can register your interest in Power BI over on office.microsoft.com, and they should send you an invite within a few days to get started with your own site.
Once your invitation is through, you can follow the steps to set up your site. Things may go a little funny at this stage; I had to set up a new organisation account for Office 365, which seems to constantly get confused with my regular Live account and cause all kinds of permission errors and the like. My issues notwithstanding though, setup’s pretty simple and you can just follow the steps to set up your Office 365 space (essentially a SharePoint server) and enable Power BI to create your first site.
Why is this any better than Sharepoint?
Now, you might ask what Power BI for Office 365 offers that you can’t do with an in-house Sharepoint server. There may be many reasons why you might want to adopt this approach, but the top 5 that jump straight out at me are:
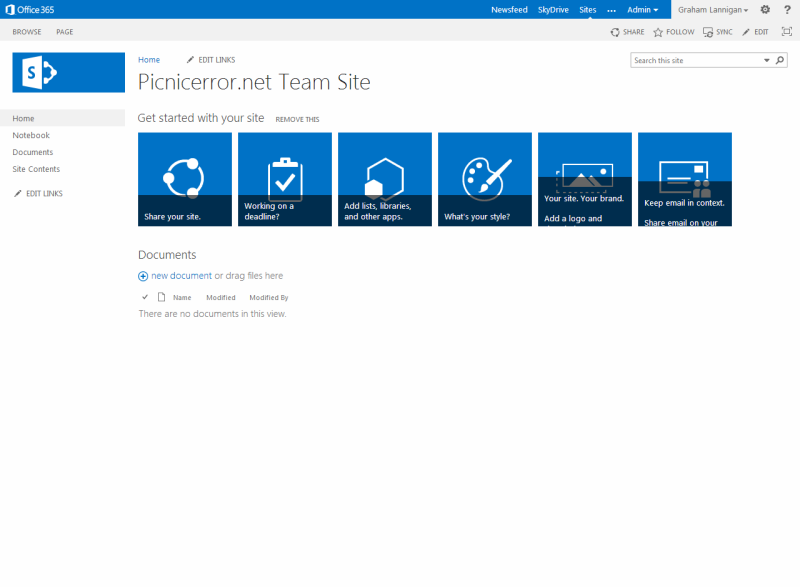
Office 365 Team Site homepage, with Power BI as a menu option.
- Affordability - I believe that Power BI requires Office 365 ProPlus, which costs £10.10 per user per month (please let me know if you know otherwise), although the trial is free. This may become a factor depending on how many users you need.
- Configuration/Management overhead - No Sharepoint server to install and configure.
- Portability - The Power BI Windows 8 app and HTML 5 support via web browser means your visualisations can be viewed on a multitude of devices.
- Remote Access - Web-based management, so no need to set up VPN access to a Sharepoint server.
- Scalability - Cloud-based, so no need to worry about scaling to suit increased demand.
The fact that Office 365 provides a cloud-based BI platform just takes so much pressure off the organisation, and allows them to focus on collating, analysing and sharing data, without having to worry about the hardware and plaform side of things.
Some observations on Power BI so far
Naturally, some aspects of the Power BI Preview work better than others. The existing Excel add-ins are all being further developed and having new features added all the time, but here is a quick summary of a few of the best and worst points I’ve discovered so far:
Sharing Power Queries
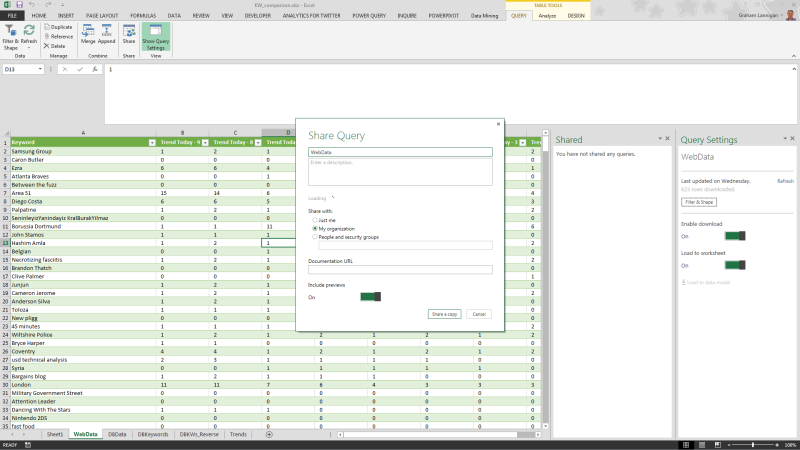
You can now access shared queries or upload your own Power Query to your Power BI site.
Power Query is a fantastic add-in for Excel that allows you to ETL data extremely quickly. The downside previously was that your created query would just live in your Excel sheet, meaning if you wanted to share it you had to pass your Excel sheet around the organisation. Fortunately, one of the things that Power BI enables is the ability to sign in to your organisational account through Excel, create your Power Query, and then publish that to your Power BI site for others to use.
If the “Sign-In” option isn’t available on the Power Query ribbon in Excel, you may need to download the latest version of the Power Query add-in.
Q&A
Perhaps the most exciting feature of Power BI, and the one that made the audience go wild at the reveal back in July, is Q&A.
Q&A offers a Natural Language Query environment, where you can type a query in something close to plain English. Q&A will quickly examine all of the datasets on your Power BI site, figure out which one you’re talking about, and generate a Power View on the fly, displaying the results of your query. What’s more, is you can then quickly edit that Power View to work how you expect, changing the fields around to tile, map or repeat your data based on any given dimensions.
It’s not perfect, and certainly can’t understand everything. There’s a trick to how your queries need to be structured, referencing field names and certain aggregations and views. However, it’s a fantastic effort, and is only going to get better as Microsoft tune the functionality. You can already create synonyms for your fields in Power Pivot, expanding Q&A’s recognised terms, and chances are this feature is only going to get better.
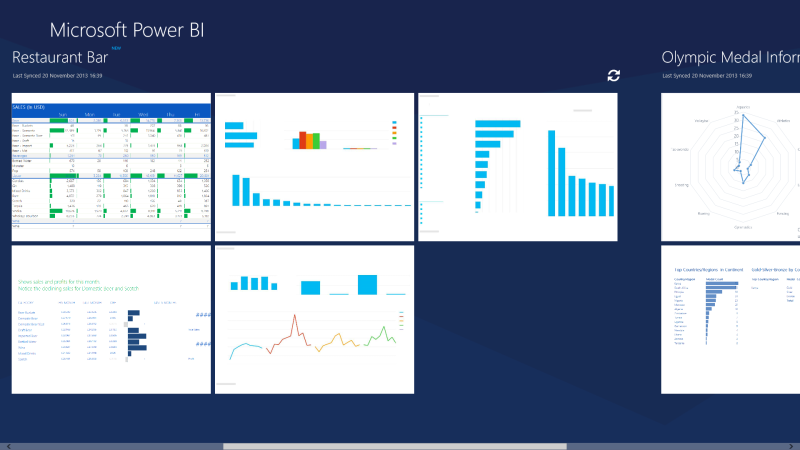
Windows 8 App/HTML 5 Power View

The Windows 8 Power BI app can display visualisations from your Power BI site on a Windows 8 tablet.
One of the most exciting things about Power BI is definitely the movement towards proper Mobile BI support. This is something that I touched on this time last year following Microsoft’s announcement of “Project Helix”, which has finally seen the light of day in the form of the new Windows 8 Power BI app, all based on an HTML5 version of Power View. Unfortunately, not all of Power View’s visualisations are supported in HTML5 yet, so it’s still very limited in what you can view. However, Microsoft have put HTML5 Power View at the very heart of Power BI, and it’s only a matter of time before full HTML5 support is in place.
Once this is done, then conceivably any device can view Power View reports that are hosted on a Power BI site. Very exciting for both data professionals and data consumers alike, regardless of their mobile platform.
Overall Feel of Office 365
The whole setup of the Power BI/Office 365/Sharepoint web offering feels a bit disjointed and over complicated.
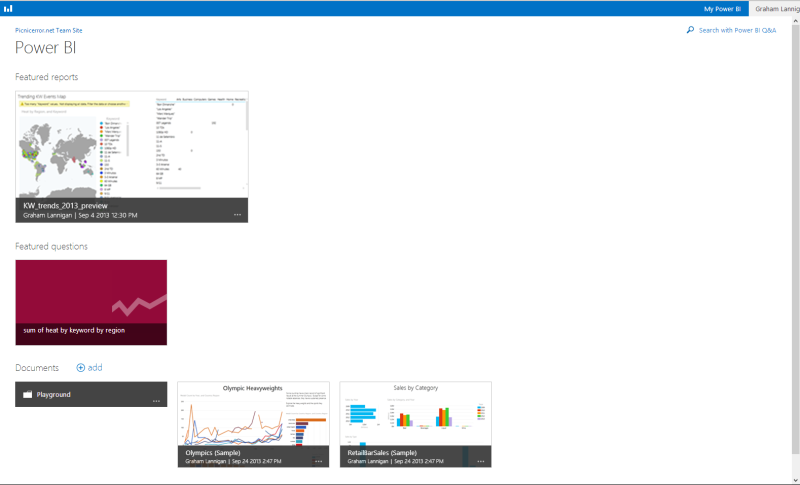
The Power BI site dashboard, shows uploaded documents, and saved Q&A questions.
Each part of the site feels like its own separate site, rather than part of a unified offering. There are different menu structures and navigation, and sometimes it’s hard to navigate from one area to another (say from your Power BI site back to Office 365).
In many ways, the Power BI/Office 365/Sharepoint platform suffers from the same problems as Sharepoint itself, being comprised of many different parts which don’t quite work as well together as they should. It’s very much a work in progress though, and I have no doubt that the disparate parts will come closer together as the platform develops. I’d much rather Microsoft keep the focus on adding new features, as they currently are.
Conclusions
Power BI for Office 365 is a serious step by Microsoft to push towards a BI solution that’s both flexible and portable. Integrating the Power BI site with Office 365 is also a very clever move that pushes organisations towards a per-seat licencing model, rather than volume licencing, something that could prove highly expensive for large organisations. However, I feel that it definitely makes MSBI more accessible to smaller organisations and dedicated teams who perhaps can’t justify the expense buying and running Sharepoint Enterprise, but can spare a couple of hundred per month and continue to work with data in Excel.
I’ve been very slow in getting round to sharing my impressions of Power BI due to just not having the time to spare lately. However, I’m getting back into it with a vengeance over the next few weeks, so keep an eye out for more posts soon! In the meantime, if you’ve been working with the Power BI Preview, why not share your thoughts below?